
September 2026 Stock Market Outlook: Good Jobs, Expensive Money

AssetScreener Research · Weekend Market Brief
The awkward thing about Friday’s jobs report is that it gave both sides something they wanted. The economy looked less fragile. The case for cheaper money looked less comfortable.
Our stock market outlook for September 2026 starts there: better growth is not automatically better for share prices when it also raises the interest-rate hurdle. August’s 162,000 payroll gain and the subsequent rise in Treasury yields put that tension back in focus. [1] [2]
Our working view: this is a growth-versus-rates test, not convincing evidence of either an imminent recession or a fresh all-clear for equities. The useful question is whether earnings and demand can remain firm while inflation cools enough to stop financing conditions getting worse.
Why did stocks fall after a stronger jobs report?
A share price reflects more than the next earnings number. It also reflects what investors will pay today for those future earnings. Better employment can support sales, but a higher expected path for interest rates can reduce the valuation investors are willing to pay. That is the mechanism we think best fits Friday’s reaction; it is an interpretation, not proof that one release caused every market move.
| U.S. index | September 4 close | Day | Week |
|---|---|---|---|
| S&P 500 | 7,718.60 | −0.4% | +0.1% |
| Nasdaq Composite | 26,506.99 | −0.3% | +0.4% |
| Dow Jones | 53,414.25 | −0.5% | −0.3% |
| Russell 2000 | 2,975.65 | +0.2% | +0.1% |
Source: Associated Press, September 4 closing report. Percentage moves rounded to one decimal; these are price-index changes, not total returns. Nasdaq Composite is not the Nasdaq-100. [2]
The two-year Treasury yield reached a reported 4.37% on Friday. Reuters reported a 57% futures-implied chance of a September rate increase late that day. That is a dated market estimate—not a Fed commitment, our forecast, or a probability that should be treated as fixed. [2] [3]
The distinction matters. Investors can agree that the economy is holding up and still decide that yesterday’s valuation was too generous. But a modest decline in the large-cap indexes, alongside a positive Russell 2000, is not evidence of indiscriminate selling. Comparing four indexes is also not a substitute for measuring constituent-level market breadth.
The August jobs report was stronger. Its composition still matters.
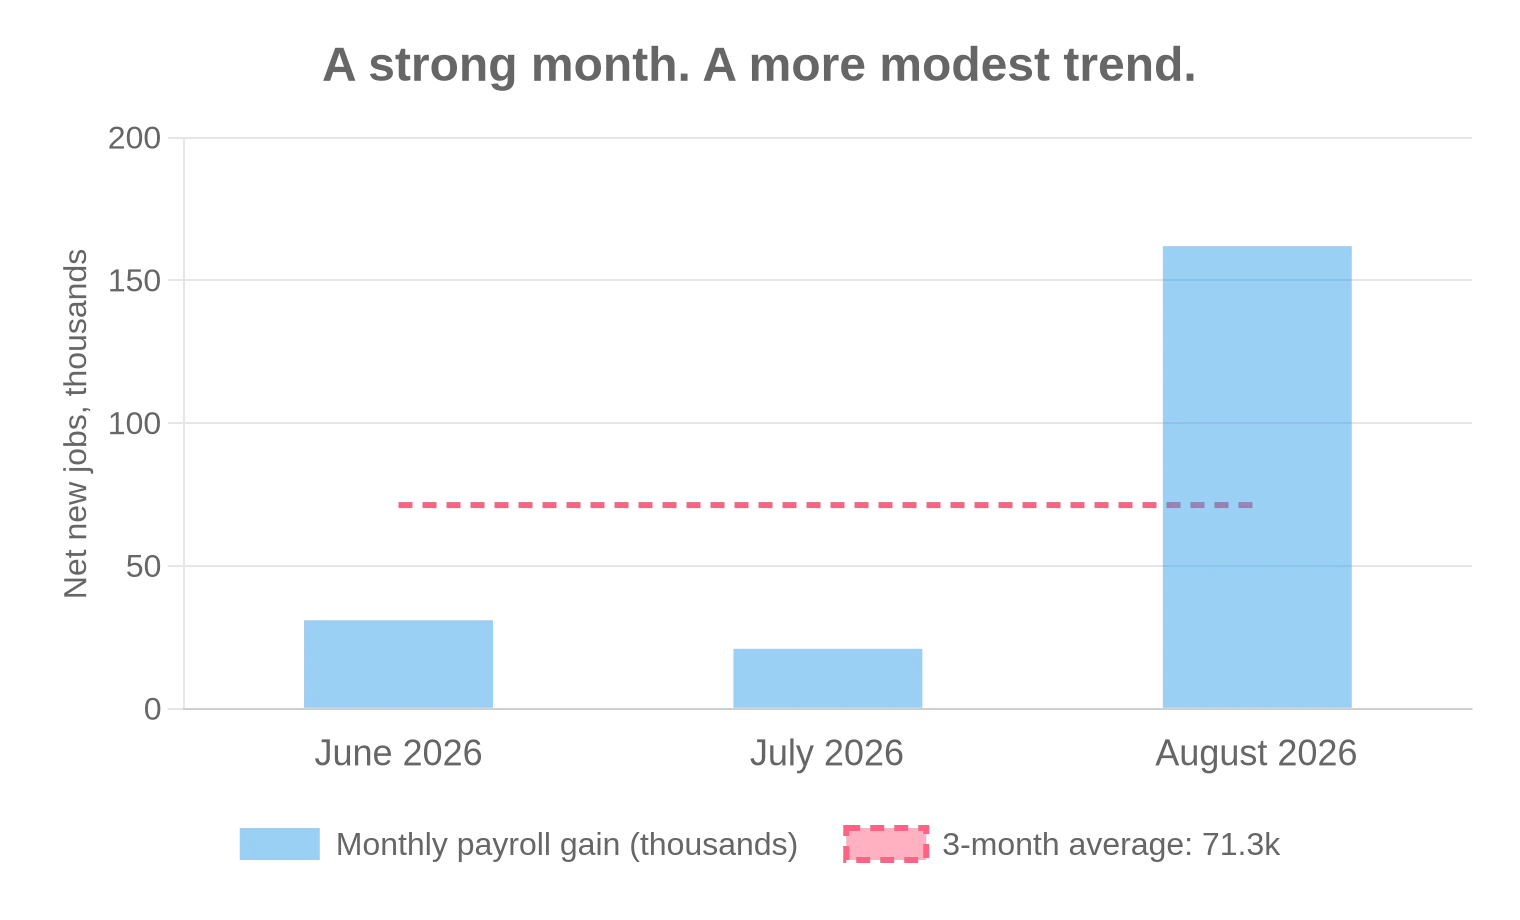
The BLS reported 162,000 additional nonfarm jobs in August, unemployment unchanged at 4.1%, and average hourly earnings up 3.1% over a year. June and July were revised to gains of 31,000 and 21,000, respectively—an upward revision of 55,000 jobs combined. That revision strengthens the improvement; it should not disappear behind a cautious reading of August. [1]
Here is the first useful calculation: those three monthly gains average 71,333 jobs. August was a genuine improvement, but the recent trend was much more modest than the latest number alone suggests. Neither the latest month nor that short average is a recession test.
The second calculation concerns concentration. Food services and drinking places added roughly 59,000 jobs; local government education added 42,000. Together, that is approximately 62.3% of August’s net increase, using the release’s rounded figures. The BLS notes that education’s gain largely offset a decline the previous month. [1]
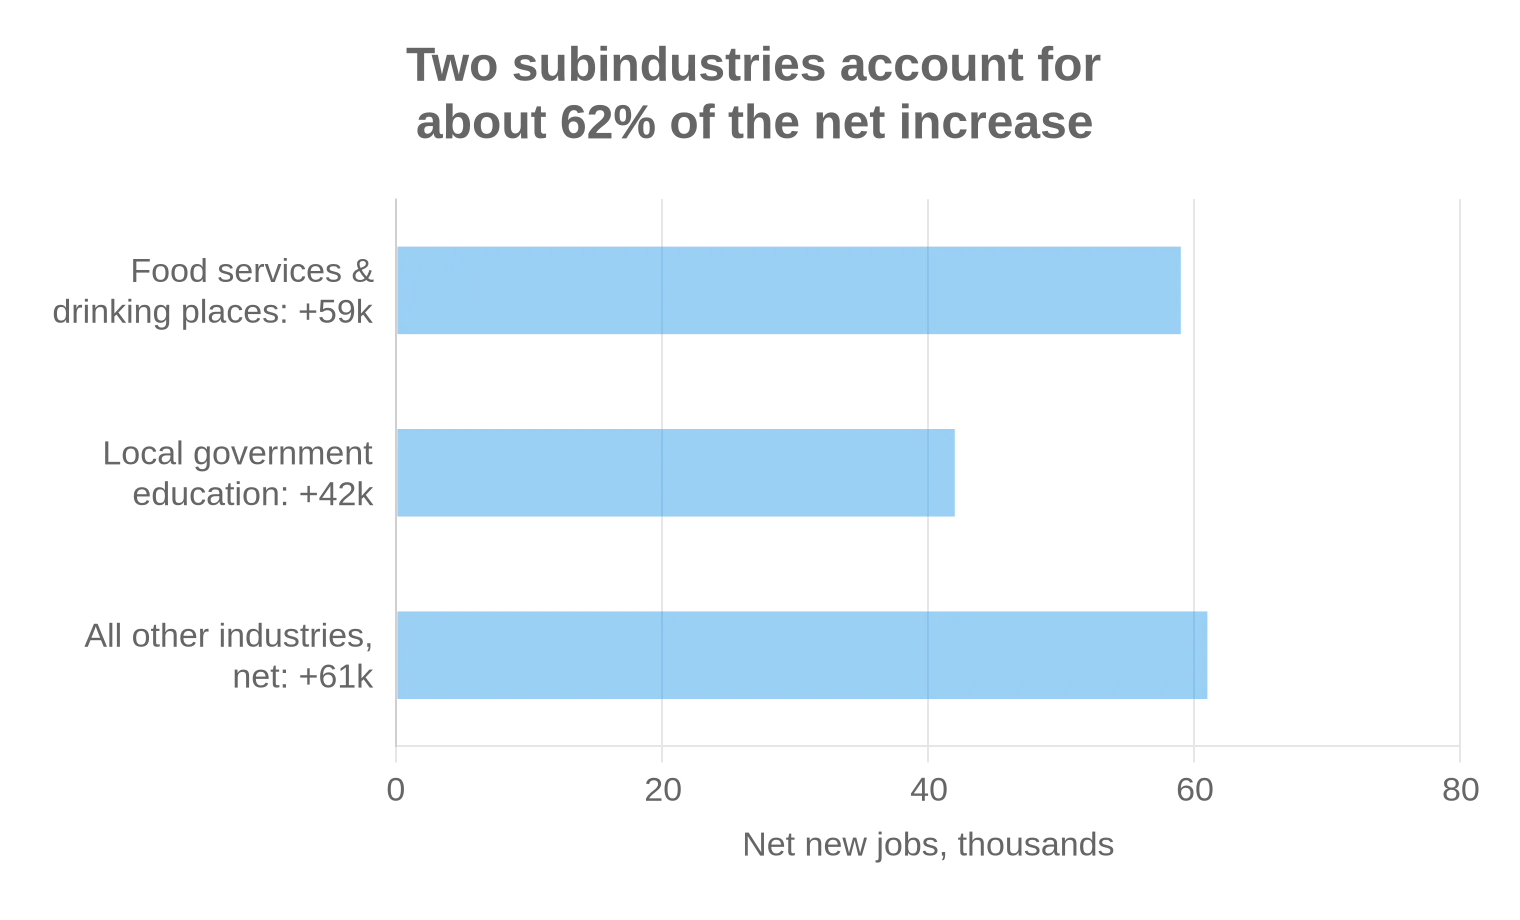
There is an important counterweight: the BLS private-industry diffusion index rose to 55.6 from 52.8. Above 50 indicates a balance tilted toward industries adding rather than losing jobs, with unchanged industries given half weight. So hiring breadth improved too. The concentration calculation describes the size of contributions to the net gain; it does not show that only two industries were hiring. [1]
There is no reason to dismiss restaurant or education employment as somehow unreal. Our conclusion is narrower: August improved in both headline hiring and breadth, but a sustained acceleration still needs more than one month. We would want repeat improvement before upgrading that conclusion.
Show the chart data and calculations
Monthly net payroll changes: June +31,000; July +21,000; August +162,000. Three-month average = (31,000 + 21,000 + 162,000) ÷ 3 = 71,333.3. Concentration = (59,000 + 42,000) ÷ 162,000 × 100 ≈ 62.3457%, or 62.3% to one decimal. Residual = 61,000. The concentration estimate uses rounded narrative figures, rather than claiming precision to the individual job. Release vintage: September 4, 2026.
Slow headline growth does not mean demand has collapsed
The GDP report is another place where the headline can mislead. In its August 26 second estimate, the BEA put second-quarter real GDP growth at 1.5% annualized, down from 2.1% in the first quarter. Yet real final sales to private domestic purchasers rose 4.2% annualized. That latter measure combines consumer spending and private fixed investment, excluding government spending, inventories and net exports. [4]
Our inference: the private-demand picture was firmer than the headline GDP number suggests. That is a reason to resist an easy recession story. It is not a reason to assume every household, industry or listed company is doing well.
The more recent consumption reading was less energetic. July real consumer spending increased by less than 0.1%, rounded to 0.0% month over month. The PCE price index rose 3.7% year over year; excluding food and energy, it rose 3.3%. Both headline and core PCE increased 0.2% during July. Monthly changes, annual inflation and annualized quarterly GDP growth are different measures; they should not be compared as though they describe the same period. [5]
That is the tension the Fed has to resolve: inflation remains elevated, but the latest monthly core reading is not by itself evidence of a fresh inflation surge. At its July meeting the Fed kept the target range at 3.50%–3.75%. The minutes subsequently showed that many participants considered tightening likely to be necessary if inflation did not decline. The condition is important. [6] [7]
Our conclusion is not “a hike is inevitable.” It is “a painless return to cheaper money still needs to be earned by the data.” Follow the underlying releases in our inflation dashboard and Treasury yield-curve view.
Good earnings can still produce a flat share price
This is the part of the September outlook that deserves more attention than a binary “bullish or bearish” label. A company can deliver better profits and still disappoint investors if the multiple paid for those profits falls.
Illustration · not a current S&P 500 valuation
Assume earnings per share rise 10%, while the price-to-earnings multiple falls from 22× to 20×.
Price change = 1.10 × (20 ÷ 22) − 1 = 0%.
A simplified arithmetic example, excluding dividends. It is not a forecast or an estimate of today’s index multiple. Rising yields do not mechanically determine a particular P/E.
The practical research question is therefore not simply whether an AI supplier, industrial business or consumer company can grow. It is whether its cash-flow improvement can compensate for a less forgiving valuation. Profit growth, refinancing exposure and the price already paid all belong in the same analysis.
That is also why we would separate evidence of demand from enthusiasm about a theme. Our earlier Nvidia earnings and AI-infrastructure brief examines the company-results side of that question. This update addresses the interest-rate side; it does not assume all AI-related businesses deserve the same valuation.
The strongest counterargument: growth may be doing the work
A bearish reading has to clear a higher bar than “bond yields went up.” Resilient demand can support future earnings, and an orderly cooling in inflation can reduce policy pressure without requiring a collapse in employment. The BEA’s private-demand estimate and July’s 0.2% monthly core-PCE reading leave that possibility open. [4] [5]
We would become more constructive if inflation cooled, yields stopped rising persistently and participation in the equity advance improved beyond a few leaders. We would become more cautious if yields rose while earnings expectations weakened. Those are different economic combinations, even when the index produces the same red daily candle.
One useful cross-check is credit. If companies face both higher government-bond yields and wider credit spreads—the additional yield lenders demand over government debt—the financing squeeze is broader than a change in Treasury pricing alone. We have not calculated a fresh credit-spread or constituent-breadth signal for this brief, so neither is presented as a current confirmation. The financial-conditions dashboard provides a place to continue that check.
Three scenarios, with evidence that could change the view
These are conditional research scenarios, not a backtested signal, probability model or instruction to trade.
Growth without another inflation push
Look for: cooling core inflation, stabilizing Treasury yields and wider participation in equity gains.
Implication: earnings have more room to support prices without another valuation squeeze.
What weakens it: repeated upside inflation surprises or renewed pressure on financing costs.
A selective, rate-sensitive market
Look for: uneven economic releases, no clear inflation resolution and sharp reactions around CPI and the Fed.
Implication: company-level delivery matters more than a blanket risk-on label.
What changes it: sustained disinflation, or a broader deterioration in earnings and credit.
Higher financing costs, weaker earnings
Look for: persistent yield increases alongside weaker profit expectations and wider credit spreads.
Implication: both the earnings outlook and the valuation multiple come under pressure.
What weakens it: contained credit stress, resilient profits and a durable easing of inflation.
The September CPI report is the next test—not the answer in advance
| Date | Event | What we will examine |
|---|---|---|
| September 10 | August PPI 08:30 EDT / 12:30 UTC | Whether producer-price pressure is broadening; not a substitute for the consumer-price release. |
| September 11 | August CPI 08:30 EDT / 12:30 UTC | The monthly core reading and its composition, then the reaction in two-year yields and equities. |
| September 15–16 | FOMC meeting | The policy decision, economic projections and guidance on what would justify the next move. |
Official schedules: BLS September release calendar and Federal Reserve 2026 meeting calendar. September’s FOMC meeting is scheduled to include economic projections. Schedules can change. [8] [9]
Reuters’ September 4 poll put expectations at a 0.4% monthly headline CPI increase and 0.2% core. Those are pre-release expectations, not actual August inflation. A number below expectations is not automatically bullish either: the composition of the report and the response in yields matter. [3]
Our order of work is simple: read the release, separate the monthly move from the annual comparison, check the bond-market response, and only then decide whether the equity narrative needs to change. A headline arriving first does not make it the most informative part of the report.
What this means for Bitcoin—and what it does not
The same distinction applies to Bitcoin: a macro backdrop is not a cycle signal. Higher yields can raise the opportunity cost of holding a non-income-producing asset, but that mechanism alone does not establish Bitcoin’s next price move. Asset-specific demand and the durability of its own trend still need to be examined.
Our September 2 Bitcoin macro outlook provides that separate, dated analysis. Its market levels are a historical snapshot, not live quotes.
Related project disclosure: AssetScreener and BitcoinReversal share a founder. BitcoinReversal provides a rules-based framework for interpreting long-term Bitcoin cycle conditions. This brief does not calculate a new product signal or forecast a market top or bottom.
The bottom line
We would not turn one strong payroll print into an all-clear, or one modest down day into a crash thesis. The September test is whether growth can keep supporting earnings without keeping upward pressure on the cost of capital.
Watch inflation, yields and the durability of earnings together. The economy can improve while the price investors should pay for that improvement becomes more demanding.
Sources, calculations and editorial boundaries
What is original: the payroll calculations and grouping, chart presentation, earnings/valuation illustration and conditional cross-asset interpretation. The underlying economic data and standard statistical measures are credited below. This is a research brief, not an independently validated market-timing model. The working scenario has no assigned statistical probability.
Data discipline: information available by September 5, 2026, 18:00 UTC. Employment figures use the September 4 release vintage; GDP uses the August 26 second estimate; PCE refers to July. Economic estimates may be revised. Charts are static so later revisions do not silently rewrite this brief. External dashboards may show newer observations.
Editorial responsibility: Simon / AssetScreener Research. See our methodology, editorial policy and corrections policy. Report a factual error through Contact.
- BLS: The Employment Situation — August 2026. Released September 4; payrolls, unemployment, wages, revisions and industry diffusion.
- Associated Press: September 4 U.S. stock-index closing report. Index closes, daily/weekly changes and the reported two-year Treasury yield.
- Reuters: Wall Street week ahead — inflation and the rate trajectory. September 4; late-Friday futures pricing and pre-release CPI expectations.
- BEA: GDP second estimate, second quarter 2026. Released August 26; annualized real GDP and private domestic final sales.
- BEA: Personal Income and Outlays, July 2026. Released August 26; real spending and PCE inflation.
- Federal Reserve: July 29 FOMC statement. Target range and policy decision.
- Federal Reserve: July 28–29 meeting minutes. Released August 19; conditional discussion of tightening.
- BLS: September 2026 release calendar. PPI and CPI dates and Eastern Time release times.
- Federal Reserve: FOMC meeting calendar. September 15–16 meeting and scheduled economic projections.
Image credits: cover photograph by Tom Coe / Unsplash, used under the Unsplash License. It is an illustrative city photograph, not a photograph of the September 4 trading session. Payroll charts: AssetScreener calculations using BLS data.
Risk: educational market research, not personalized investment advice. Scenarios can fail, asset prices can fall and past relationships can change. Read the risk disclosure.