
Bitcoin’s Biggest Weekly Rebound Since 2024: Breakout, Fakeout — or a New Liquidity Regime?

Bitcoin did not bounce in isolation. The bond market, the dollar and policy expectations all moved at once.
Bitcoin pushed back above $77,000 after the U.S. Treasury expanded long-duration bond buybacks, the dollar weakened and short-covering accelerated. That makes the move more interesting than a random crypto spike — but it still needs confirmation.
SOURCE-LINKEDmarket brief
Our working view is constructive but conditional: the rebound is macro-supported, yet the strongest bullish weekly candle on our chart since 2024 is only the first half of a breakout. The second half is holding the reclaimed zone when the initial excitement fades.
AssetScreener Research · August 23, 2026
Market context uses official U.S. policy and inflation data plus source-linked market reporting through August 21–22. Technical levels are observational, not personalized investment advice.
The rebound still needs confirmation.
Bitcoin was trading near $76,950 in the September 2 Reuters snapshot, just below the $77,000–$80,000 confirmation area identified in the original brief. The rebound has therefore not yet established sustained acceptance above the reclaimed zone.
The cross-asset backdrop also became less supportive. Brent crude traded near $95, the U.S. 10-year Treasury yield reached about 4.81% and the dollar strengthened as renewed U.S.–Iran conflict increased inflation concerns. That does not invalidate the rebound thesis, but it lowers confidence until Bitcoin can reclaim the upper zone and hold it through subsequent weekly closes and pullbacks.
Status assessment: breakout unconfirmed. The original constructive-but-conditional framework remains valid; the next evidence must come from sustained price acceptance rather than another isolated impulse.
Why did Bitcoin suddenly wake up?
The immediate catalyst was the U.S. Treasury’s decision to at least double certain buybacks of older long-dated Treasuries to $4 billion per operation. The move briefly eased pressure in bonds, hit the dollar and helped revive the “debasement” trade — gold and Bitcoin both benefited.
At the same time, Washington renewed its push for clearer crypto regulation, while weeks of narrow trading left a crowded short base vulnerable. Once price broke higher, short-covering amplified the move.
- Bitcoin
- >$77kthree-month high area
- Weekly move
- ~20%strongest in ~2.5 years
- Dollar
- weakerthree-month low vs euro
- M2
- $23.16TJune 2026
Treasury buybacks changed the short-term conversation around long yields and the dollar. The announcement was not QE, but markets read it as a sign that policymakers are uncomfortable with disorderly long-duration stress.
Is this a durable shift into a friendlier liquidity regime — or did a policy headline simply trigger a short squeeze inside a still-fragile market?
The spark came from Treasuries, not from a crypto meme.
On August 19, the U.S. Treasury surprised markets by expanding buybacks of longer-dated government debt. Reuters reported that the cap for certain operations would rise to at least $4 billion, after a major selloff had pushed the 30-year Treasury yield to its highest level since 2007.
The mechanics matter. Treasury buybacks are not the same as Federal Reserve quantitative easing. They are primarily a debt-management and market-liquidity tool. But markets care about the signal as much as the plumbing: if officials are willing to lean against stress in long-duration bonds, investors naturally ask where the adjustment shows up instead. For a few sessions, the answer was the dollar.
The dollar fell toward a three-month low against the euro, while gold and Bitcoin both rallied. Reuters noted that Bitcoin was up roughly 13% over two days after the announcement. That is a classic cross-asset clue: this was not simply “crypto sentiment got better.” It was a repricing across bonds, FX and hard assets.
A good macro spark landed on a market full of dry tinder.
Bitcoin had spent weeks trading in a narrow, frustrating range after a much larger decline from its earlier highs. That matters because compressed markets accumulate positioning. When the first macro catalyst arrived, the move was amplified by traders rushing to exit bearish positions.
Reuters explicitly described the rally as being fueled by short-covering. Other market reporting estimated more than $4 billion of bearish crypto positions were liquidated as the move accelerated. In other words, the first buyers pushed the door open — then shorts helped kick it off the hinges.
There was also a policy tailwind. President Trump again urged Congress to pass the CLARITY Act, which aims to define a clearer regulatory framework for digital assets. Whatever one thinks of the politics, markets tend to reward reduced regulatory uncertainty.
That combination — macro catalyst, weaker dollar, regulatory optimism and forced short-covering — explains why Bitcoin moved faster than many traditional risk assets.
The backdrop was already becoming less hostile before the headline hit.
U.S. M2 has been rising again. FRED shows seasonally adjusted M2 at $23.155 trillion in June, up from $23.056 trillion in May and $22.800 trillion in April. M2 is not a magic Bitcoin timing indicator, and it should never be treated as one. But sustained expansion in broad money is generally more supportive for financial assets than contraction.
Inflation has also cooled at the margin. The Bureau of Labor Statistics reported July CPI up 0.1% month over month and 3.4% year over year, while core CPI rose 0.2% on the month and 2.5% over twelve months. That is still above the Federal Reserve’s goal, but it is less hostile than a fresh inflation re-acceleration.
The Fed itself remains cautious. On July 29 it held the federal-funds target at 3.50%–3.75% and continued its policy of maintaining ample reserves. Importantly, three policymakers dissented in favor of a 25-basis-point hike. So the backdrop is not “easy money is back.” It is closer to this: liquidity is improving, inflation is cooling somewhat, but policy remains restrictive enough that markets still have to earn their upside.
The candle is enormous. That is information — not confirmation.
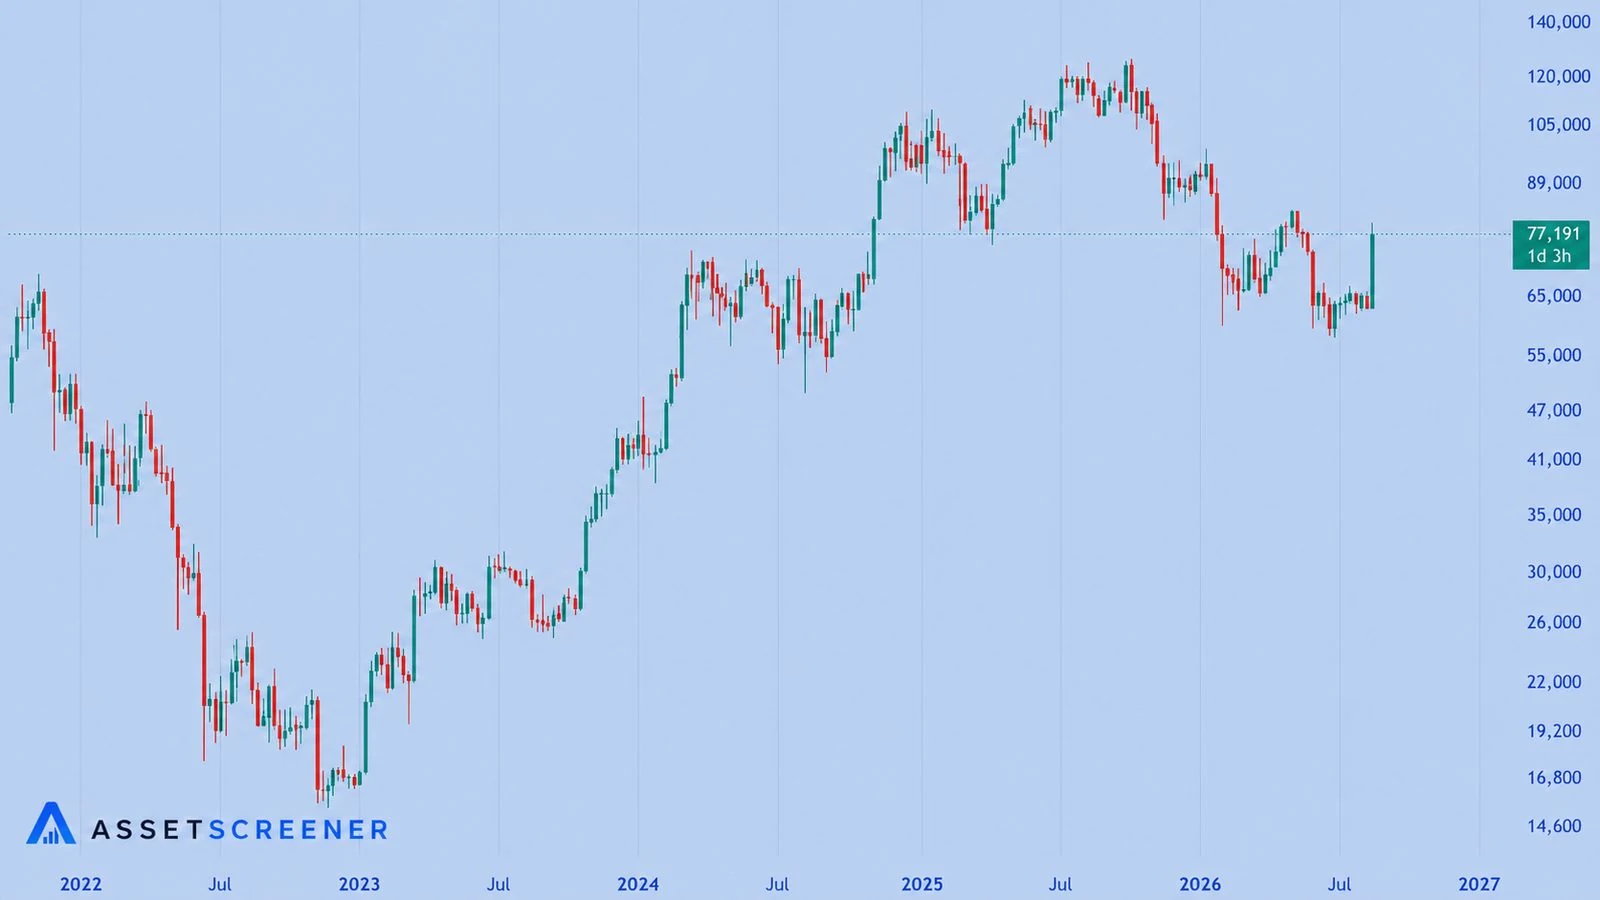
Large weekly candles usually tell us that the market has been forced to reprice. They do not tell us, by themselves, that the new price is accepted.
The first technical test is the $77,000–$80,000 area. Price is now challenging a zone where the market can either build a new base or reject sharply. A weekly close that holds the upper part of this move would be constructive. A fast reversal back through the low-$70,000s would make the rally look more like an exhaustion event.
Hold the $77k–$80k region and turn the breakout area into support rather than resistance.
The low-$70k area. A controlled retest is healthy; a violent loss of it would weaken the breakout thesis.
A return toward roughly $65k would put Bitcoin back inside the prior range and materially strengthen the fakeout case.
What would make this rally fail?
The bearish argument is not complicated. Treasury buybacks were a relatively small intervention, and Reuters noted that the relief in bonds was short-lived. Long yields remain high, oil is elevated, and the Fed is still worried about inflation. If those pressures persist, the liquidity narrative can reverse just as quickly as it appeared.
There is also a positioning problem. Short-covering can create breathtaking upside, but forced buying eventually runs out. A durable trend needs fresh spot demand and willingness to buy after the first pullback — not only traders buying because their shorts are on fire.
The cleanest fakeout signature would be: explosive weekly breakout, little follow-through, then a close back below the breakout zone. Markets are very good at looking most convincing exactly when the last skeptical trader finally gives in.
This is risk-on — but it is not a clean “everything rally.”
Bitcoin’s rebound matters beyond crypto because it arrived alongside a weaker dollar and stronger gold. Gold reached a three-month high and gained more than 5% for the week, while the dollar weakened under fiscal and bond-market pressure. That combination looks less like a simple growth boom and more like investors seeking assets that can benefit if confidence in long-duration government debt or fiat purchasing power weakens.
Equities were more mixed. U.S. stocks rose on Friday, but the S&P 500 and Nasdaq still ended the week lower. Reuters reported the S&P 500 down 1.43% for the week and the Nasdaq down 2.05%, with high bond yields and geopolitical oil risk still hanging over the tape.
So the broader signal is nuanced: liquidity-sensitive and scarcity assets are responding first, while equities still have to prove that high yields will not choke the next leg of the expansion.
Three ways this resolves from here
These are monitoring frameworks, not forecasts.
Breakout becomes acceptance
Bitcoin holds above the reclaimed zone, the dollar stays soft and M2 continues to expand. Pullbacks become shallow and buyers step in before the prior range is retested.
- Confirmation
- Weekly closes above the breakout area; improving breadth across crypto and risk assets.
- Invalidation
- Fast loss of the low-$70k region.
Volatile repricing, then consolidation
The first squeeze cools, Bitcoin spends several weeks digesting the move, and the market waits for new macro data.
- Confirmation
- Range develops above prior support without a full retracement.
- Invalidation
- Breakdown through the mid-$60k region.
Policy headline becomes a trap
Long yields resume their climb, inflation anxiety returns and the dollar stabilizes. Short-covering exhausts itself and Bitcoin falls back into the old range.
- Confirmation
- Weekly rejection below the breakout zone followed by a loss of ~$65k.
- Invalidation
- Sustained closes above the current rebound region.
Where BitcoinReversal fits into the picture
AssetScreener looks at Bitcoin as part of the wider cross-asset system: liquidity, rates, the dollar, inflation, capital flows and market structure. For investors who want to assess long-term Bitcoin cycle risk systematically, BitcoinReversal applies a rules-based framework to defined market and cycle conditions.
The point is not to claim certainty from one reading. It is to make the decision process explicit and repeatable. When a candle this large appears, the useful question is not “Do I feel bullish?” It is “What evidence would prove that this is a durable regime change — and what evidence would prove me wrong?”
What we are watching now
Weekly acceptance above the breakout zone
One giant candle gets attention. Two or three constructive weekly closes build a trend.
The U.S. dollar
If the dollar keeps weakening while Bitcoin and gold stay firm, the debasement/liquidity narrative gains credibility.
Long-duration Treasury yields
If the 30-year keeps pushing higher despite buybacks, the risk-asset backdrop remains less friendly than the Bitcoin chart alone suggests.
Broad liquidity trend
Whether money growth and funding conditions remain supportive after the Treasury-buyback impulse. The direction across several releases matters more than one monthly print.
Follow-through outside crypto
We want to see whether equities and other risk assets begin confirming the move rather than leaving Bitcoin and gold as isolated winners.
Plain-English interpretation
Why did Bitcoin rise so sharply this week?
The main trigger was the U.S. Treasury’s expanded long-duration bond buyback plan, which weakened the dollar and improved risk sentiment. Regulatory optimism and short-covering amplified the move.
Is the Treasury buyback the same as quantitative easing?
No. Treasury buybacks are a debt-management and market-liquidity operation, not Federal Reserve QE. The market impact can overlap in some areas, but the mechanism and authority are different.
Does the huge weekly candle guarantee a new bull market?
No. It signals a forceful repricing. Confirmation requires the market to hold the reclaimed zone and attract buyers after the first pullback.
What would make the rebound look like a fakeout?
A quick weekly reversal back below the low-$70,000s would weaken the breakout. A later loss of the mid-$60,000 region would be a much more serious technical failure.
Why does this matter for stocks?
Bitcoin is highly sensitive to liquidity and risk appetite. If its move is confirmed by a weaker dollar, stable yields and broader equity participation, it can be an early sign of a friendlier risk regime. If equities fail to confirm while yields rise, the signal is more narrow.
Open the evidence behind this edition
Primary policy and economic sources are used where available; current market moves are linked to Reuters.
- Reuters — Crypto rally after Treasury buybacks and CLARITY Act push
- Reuters — Treasury buybacks revive dollar-debasement concerns
- Reuters — Wall Street weekly close
- Reuters — Gold, dollar and technical momentum
- U.S. Bureau of Labor Statistics — July 2026 CPI
- Federal Reserve — July 29, 2026 FOMC statement
- Federal Reserve — July FOMC minutes
- FRED — M2 Money Stock
- AssetScreener methodology
- AssetScreener data sources
- Reuters — September 2 Bitcoin and cross-asset market update
How this brief was produced
This edition combines current cross-asset observations with U.S. Treasury and Federal Reserve policy context, official inflation and money-supply data, and source-linked market reporting. Facts are separated from interpretation, the strongest counter-case is shown explicitly, and the conclusion is framed conditionally rather than as a prediction.
AssetScreener Research focuses on relationships that can be checked over time: price action, liquidity, rates, the dollar, policy and the evidence that would change the thesis.
Publication details and review trail
The page keeps its publication date, source register, definitions and original-source links visible so readers can verify the context.
- Suggested citation
- AssetScreener Research (2026-08-23). Bitcoin’s Biggest Weekly Rebound Since 2024: Breakout, Fakeout — or a New Liquidity Regime? https://www.assetscreener.com/research/bitcoin-biggest-weekly-rebound-breakout-fakeout-liquidity-august-2026/
- Research scope
- Bitcoin, U.S. Treasury buybacks, liquidity, M2, U.S. dollar, inflation, Federal Reserve policy, technical analysis and cross-asset risk appetite.